When building distributed systems in the cloud, storage performance can make or break your application’s success. In this post, we’ll explore how different Azure disk types perform under distributed database workloads, using YugabyteDB as our test subject. We’ll dive deep into benchmarking methodologies and reveal practical insights about Azure storage performance characteristics.
The Azure Storage Landscape
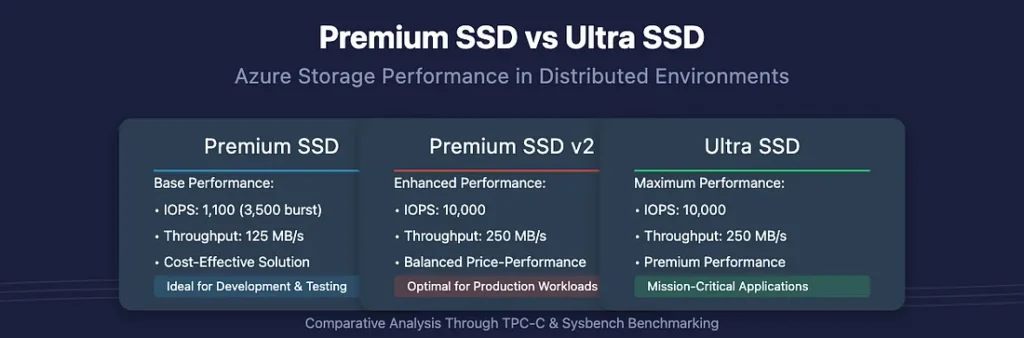
Azure offers several managed disk types, each designed for different workloads and performance requirements. We’ll focus on three key offerings:
- Premium SSD: The traditional performance-tier offering, providing consistent performance with burstable IOPS
- Premium SSD v2: A newer generation offering higher performance and more flexible scaling
- Ultra SSD: Azure’s highest-performance offering with configurable IOPS and throughput
Each of these options presents different performance characteristics and price points, making the choice non-trivial for database workloads.
Understanding Distributed Database Workloads
Before diving into performance numbers, it’s essential to understand what makes distributed database workloads unique. Unlike traditional single-node databases, distributed databases like YugabyteDB handle data differently:
- Write Operations:
- Require consensus across multiple nodes
- Need to maintain consistency across replicas
- Often involve both WAL (Write-Ahead Log) and data file writes
- Read Operations:
- May contact multiple nodes depending on consistency requirements
- Utilize caching at various levels
- Can be affected by data locality
These characteristics mean that storage performance impacts database operations in complex ways, often not directly proportional to raw disk performance metrics.
Benchmarking Methodology
To thoroughly evaluate storage performance, we need a comprehensive testing approach. We employed two industry-standard benchmarking tools:
TPC-C Like Benchmark
TPC-C is a database benchmark that simulates a complete order-processing environment. It’s valuable because:
- Models real-world business operations
- Generates mixed read-write workloads
- Tests multiple transaction types with varying complexity
- Provides insights into real-world performance expectations
Our implementation focuses on key transactions:
- New Order: Complex write-heavy transaction
- Payment: Mixed read-write transaction
- Order Status: Read-only transaction
- Delivery: Write-heavy batch transaction
- Stock Level: Read-heavy transaction
Sysbench
While TPC-C provides a high-level view, Sysbench allows us to examine specific performance characteristics:
- Enables focused testing of individual operation types
- Provides precise control over workload parameters
- Helps isolate storage performance impacts
- Allows scaling tests with different table counts and sizes
We configured Sysbench tests to examine:
- Point selects (read performance)
- Insert operations (write performance)
- Different data set sizes (20 and 30 tables)
- TPCC git repo : https://github.com/yugabyte/tpcc/releases/tag/2.0
- Sysbench git repo : https://github.com/yugabyte/sysbench/
Azure Disk Performance Comparison Tables
Test Environment Configuration
Cluster Configuration
| Configuration Parameter | Value |
|---|---|
| YugabyteDB Version | 2.18.1.0-b84 |
| Instance Type | Standard_D8s_v5 |
| Number of Nodes | 3 |
| Replication Factor | 3 |
| Region | westus2 |
| Zone Configuration | westus2-1(3) |
| Node-to-Node TLS | Enabled |
| Client-to-Node TLS | Enabled |
Storage Configuration Comparison
| Parameter | Premium SSD | Premium SSD v2 | Ultra SSD |
|---|---|---|---|
| Storage Type | Premium_LRS (P15) | PremiumV2_LRS | UltraSSD_LRS |
| Disk Volume Size | 250 GB | 250 GB | 250 GB |
| IOPS | 1,100 (3,500 burstable) | 10,000 | 10,000 |
| Throughput | 125 MB/s | 250 MB/s | 250 MB/s |
Benchmark Results
Sysbench Read Performance (20 Tables)
| Metric | Premium SSD | Premium SSD v2 | Ultra SSD |
|---|---|---|---|
| Average Latency | 13.52 ms | 12.58 ms | 12.65 ms |
| Select Latency | 1.35 ms | 1.25 ms | 1.26 ms |
| Throughput | 4,437.97 ops/sec | 4,767.33 ops/sec | 4,741.16 ops/sec |
| CPU Utilization | 77% | 80% | 79% |
| Disk IOPS | 1,300 | 1,630 | 1,350 |
| Disk Bandwidth | 30 MB/s | 39 MB/s | 31 MB/s |
Sysbench Write Performance (20 Tables)
| Metric | Premium SSD | Premium SSD v2 | Ultra SSD |
|---|---|---|---|
| Average Latency | 40.17 ms | 40.17 ms | 39.4 ms |
| Insert Latency | 4.01 ms | 4.01 ms | 3.94 ms |
| Throughput | 597 ops/sec | 597.28 ops/sec | 609 ops/sec |
| CPU Utilization | 78% | 80% | 79% |
| Disk IOPS | 1,200 | 1,200 | 1,300 |
| Disk Bandwidth | 48 MB/s | 50 MB/s | 42 MB/s |
Sysbench Read Performance (30 Tables)
| Metric | Premium SSD | Premium SSD v2 | Ultra SSD |
|---|---|---|---|
| Average Latency | 38.11 ms | 13.93 ms | 13.92 ms |
| Select Latency | 3.81 ms | 1.39 ms | 1.39 ms |
| Throughput | 1,574.48 ops/sec | 4,305.58 ops/sec | 4,310.24 ops/sec |
| CPU Utilization | 60% | 76% | 80% |
| Disk IOPS | 2,500 | 5,375 | 5,000 |
| Disk Bandwidth | 64 MB/s | 145 MB/s | 130 MB/s |
Sysbench Write Performance (30 Tables)
| Metric | Premium SSD | Premium SSD v2 | Ultra SSD |
|---|---|---|---|
| Average Latency | TBD | 40.67 ms | 41.03 ms |
| Insert Latency | TBD | 4.06 ms | 4.1 ms |
| Throughput | TBD | 590.07 ops/sec | 584.96 ops/sec |
| CPU Utilization | TBD | 81% | 81% |
| Disk IOPS | TBD | 1,750 | 1,800 |
| Disk Bandwidth | TBD | 60 MB/s | 75 MB/s |
TPC-C Performance (2000 Warehouses)
| Metric | Premium SSD | Premium SSD v2 | Ultra SSD |
|---|---|---|---|
| New-Order Latency | 177.2 ms | 110.34 ms | 94.13 ms |
| TPMC | 25,135 | 25,600.1 | 25,616.27 |
| CPU Utilization | 83% | 85.5% | 85.5% |
| Disk IOPS | 2,550 | 2,450 | 2,400 |
| Disk Bandwidth | 79 MB/s | 85 MB/s | 81 MB/s |
Benchmark Configuration Details
Sysbench Configuration
| Parameter | Value |
|---|---|
| Client Instance | Standard_D8s_v5 |
| Client Region | westus2 |
| Client AZ | 1 |
| Table Size | 15,000,000 |
| Loader Threads | 10 |
| Warm-up Time | 300 seconds |
| Execution Time | 1,800 seconds |
| Secondary Index | Enabled |
TPC-C Configuration
| Parameter | Value |
|---|---|
| TPCC Release | 2.0 |
| Client Instance | Standard_D8s_v5 |
| Client Region | westus2 |
| Client AZ | 1 |
| Loader Threads | 24 |
| Database Connections | 600 |
| Warm-up Time | 300 seconds |
| Execution Time | 1,800 seconds |
Key Performance Indicators
Latency Improvement
| Workload Type | Premium SSD v2 vs Premium SSD | Ultra SSD vs Premium SSD |
|---|---|---|
| Sysbench Read (20 Tables) | -7.0% | -6.4% |
| Sysbench Write (20 Tables) | 0% | -1.9% |
| TPC-C New-Order | -37.7% | -46.9% |
Throughput Improvement
| Workload Type | Premium SSD v2 vs Premium SSD | Ultra SSD vs Premium SSD |
|---|---|---|
| Sysbench Read (20 Tables) | +7.4% | +6.8% |
| Sysbench Write (20 Tables) | +0.05% | +2.0% |
| TPC-C | +1.9% | +1.9% |
Performance Results and Analysis
Read Performance Insights
Our Sysbench read tests revealed interesting patterns:
- Small Dataset Performance (20 tables):
- Premium SSD v2 showed a 7% latency improvement over Premium SSD
- Ultra SSD performed similarly to Premium SSD v2
- CPU utilization remained the primary bottleneck
- Larger Dataset Performance (30 tables):
- Both Premium SSD v2 and Ultra SSD significantly outperformed Premium SSD
- Premium SSD showed degraded performance with larger datasets
- Higher disk IOPS utilization observed across all types
The results suggest that for read-heavy workloads:
- Premium SSD v2 offers the best value for money
- Ultra SSD benefits become more apparent with larger datasets
- Cache hit rates significantly influence overall performance
Write Performance Characteristics
Write performance testing revealed different patterns:
- Small Dataset Performance (20 tables):
- Minimal difference between disk types
- CPU utilization remained high across all configurations
- Write latencies were consistent across disk types
- Larger Dataset Performance (30 tables):
- Premium SSD struggled with larger datasets
- Premium SSD v2 and Ultra SSD maintained consistent performance
- Higher disk bandwidth utilization observed
TPC-C Workload Analysis
The TPC-C results provide the most comprehensive view of real-world performance:
- Transaction Latencies:
- Ultra SSD: 94.13 ms New-Order latency
- Premium SSD v2: 110.34 ms New-Order latency
- Premium SSD: 177.2 ms New-Order latency
- Throughput Characteristics:
- All disk types achieved similar TPMC (transactions per minute)
- CPU utilization was consistently high (83-85.5%)
- Disk IOPS usage was moderate across all types
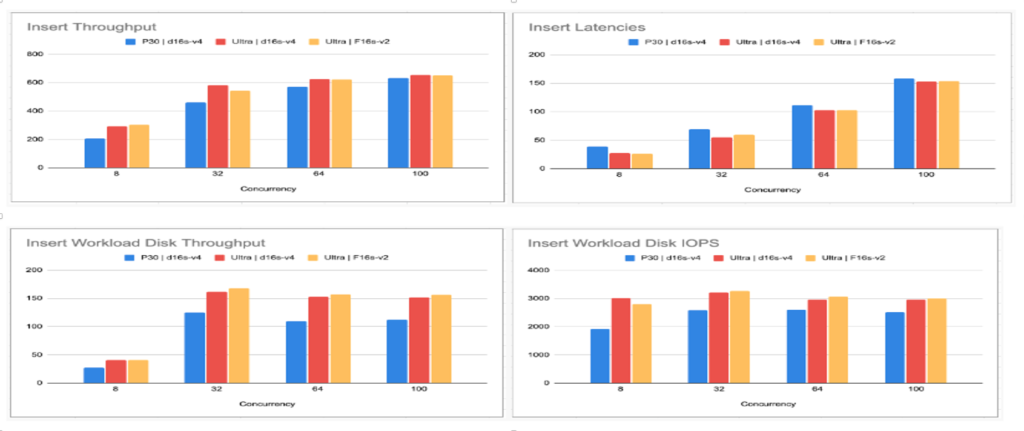
Graphs generated for each workload Throughput, Latencies, IOPS.
Key Findings and Recommendations
Based on our comprehensive testing, we can make several recommendations:
For Read-Heavy Workloads
Premium SSD v2 provides the best balance of performance and cost. The performance gap between Premium SSD v2 and Ultra SSD is minimal for read operations, making Ultra SSD harder to justify purely for read performance.
For Write-Heavy Workloads
Ultra SSD shows its value in write-intensive scenarios, particularly with larger datasets. The consistent performance and lower latencies can justify the higher cost for write-critical applications.
For Mixed Workloads
Premium SSD v2 emerges as the most cost-effective option for most mixed workloads. The performance improvements over Premium SSD are significant, while the cost remains lower than Ultra SSD.
Conclusion
Our testing reveals that Azure disk performance isn’t simply about raw IOPS and throughput numbers. The interaction between storage and distributed database workloads is complex, with CPU often becoming the limiting factor before storage performance is fully utilized.
For most distributed database deployments, Premium SSD v2 provides the sweet spot of performance and cost. Ultra SSD becomes compelling primarily for:
- Write-heavy workloads with strict latency requirements
- Large datasets with unpredictable access patterns
- Mission-critical applications requiring consistent performance
When selecting Azure disk types for your distributed database, consider:
- Your workload characteristics (read/write ratio)
- Dataset size and growth expectations
- Performance requirements and budgetary constraints
- The actual bottlenecks in your current system
Remember that storage performance is just one piece of the puzzle. A well-designed distributed database system needs to consider network topology, CPU resources, and memory configuration alongside storage performance for optimal results.